I specialize in bridging the gap between business needs and technological solutions.
With a focus on requirements
gathering, process optimization, and data-driven insights,
I translate complex objectives into actionable project roadmaps that drive efficiency and strategic growth.
Turns raw data into actionable insights. Builds dashboards and reports using tools like Power BI or Tableau to support business strategy.
Examines and interprets data to help businesses make informed decisions. Creates dashboards, reports, and visualizations using SQL, Excel, or Power BI.
Designs, manages, and queries databases. Writes SQL code to create tables, retrieve data, and support applications or reporting needs.
I turn raw data into clear, actionable insights. With skills in Power BI, SQL, and data analysis, I create dashboards, reports, and visualizations that help businesses make smarter decisions. I focus on solving problems, tracking key metrics, and delivering data-driven solutions as a Power BI Developer, SQL Developer, Data Analyst, or BI Analyst.
I am an undergraduate at the Vavuniya Campus of the University of Jaffna. I have built practical skills through hands-on projects in Power BI, SQL, and data analysis, creating dashboards, reports, and visualizations to solve real-world problems.
Information and Communication Technology(Hons)
University of Jaffna- Vavuniya Campus
Duration:2022-2026
I have strong skills in Power BI, SQL,Tableau,Excel and data analysis. I can clean, transform, and visualize data, create interactive dashboards, and generate meaningful insights.
I am an undergraduate at the Vavuniya Campus of the University of Jaffna. I am passionate about data analysis, SQL, and business intelligence, and I enjoy building practical projects to solve real-world problems.
Name
Sachini Madhubhashinie
Gender
Female
Phone
(+94) 785322986
Email
msachini959@gmail.com
Age
24 Years Old
City
Mahiyanganaya
District
Badulla
Nationality
Sri Lankan
Full Time
Available
Languages
English,Sinhala
01
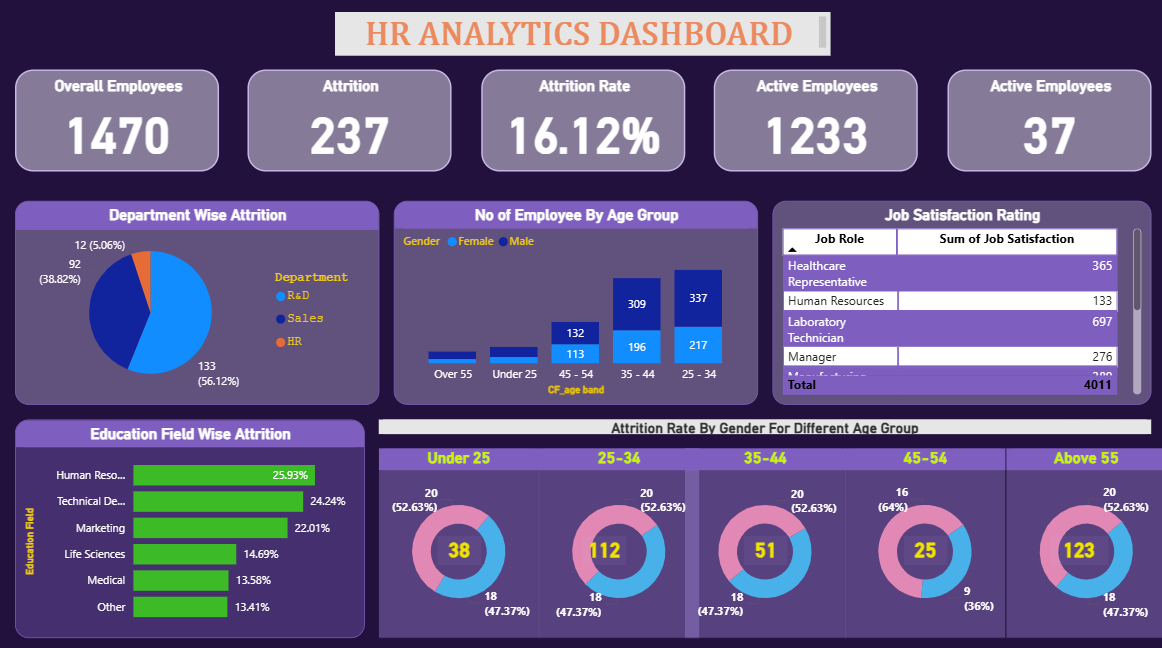
This HR Analytics Dashboard provides a clear overview of employee distribution, attrition, and job satisfaction trends. It visualizes key metrics such as department-wise attrition, age groups, education fields, and gender-based insights. The dark purple and maroon theme enhances readability while presenting workforce patterns at a glance.
Power BI
02
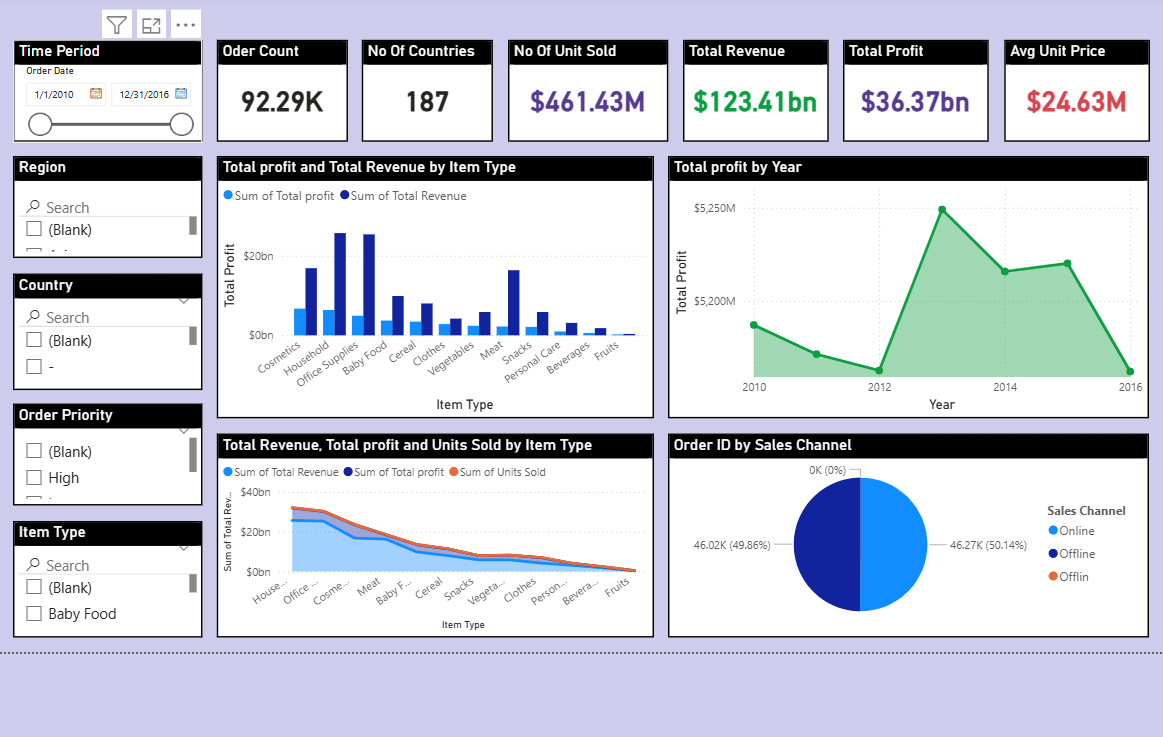
This Sales Performance Dashboard highlights key metrics like revenue, profit, units sold, and orders. It visualizes item performance, profit vs. revenue, and sales channels, with interactive filters for region, country, order priority, and item type for in-depth analysis.
Power BI
03
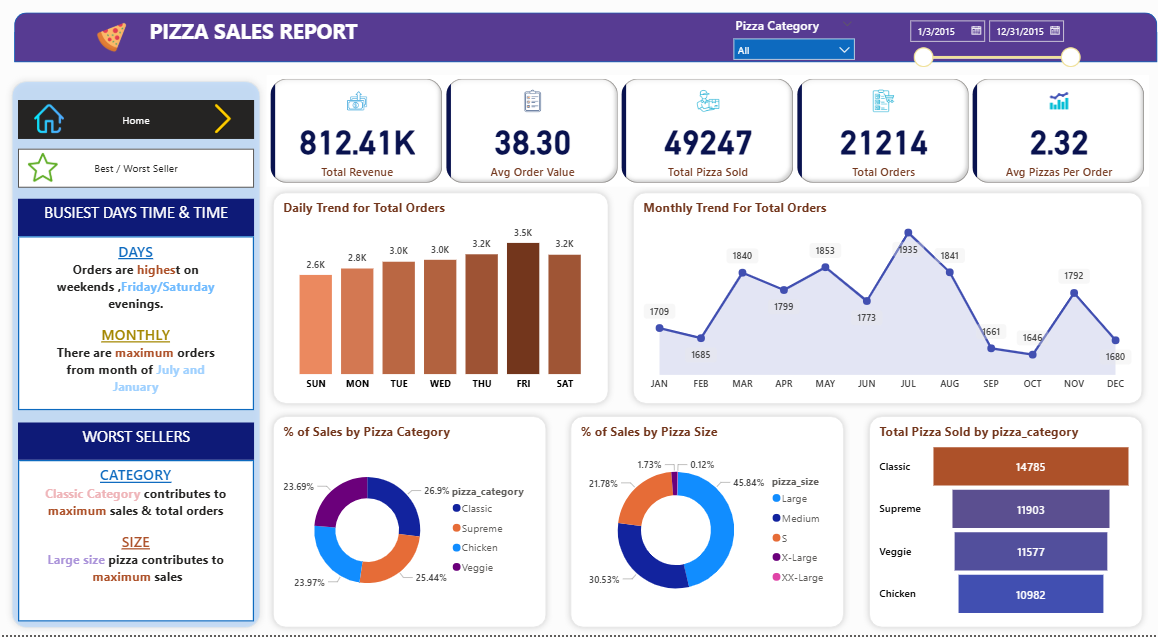
A comprehensive Pizza Sales Report project analyzing key performance metrics using interactive dashboards. Includes insights on best and worst selling pizzas by revenue, quantity, and orders, sales performance by category and size, and identification of peak sales periods across days and months using BI visualizations.
Power BI & SQL
04
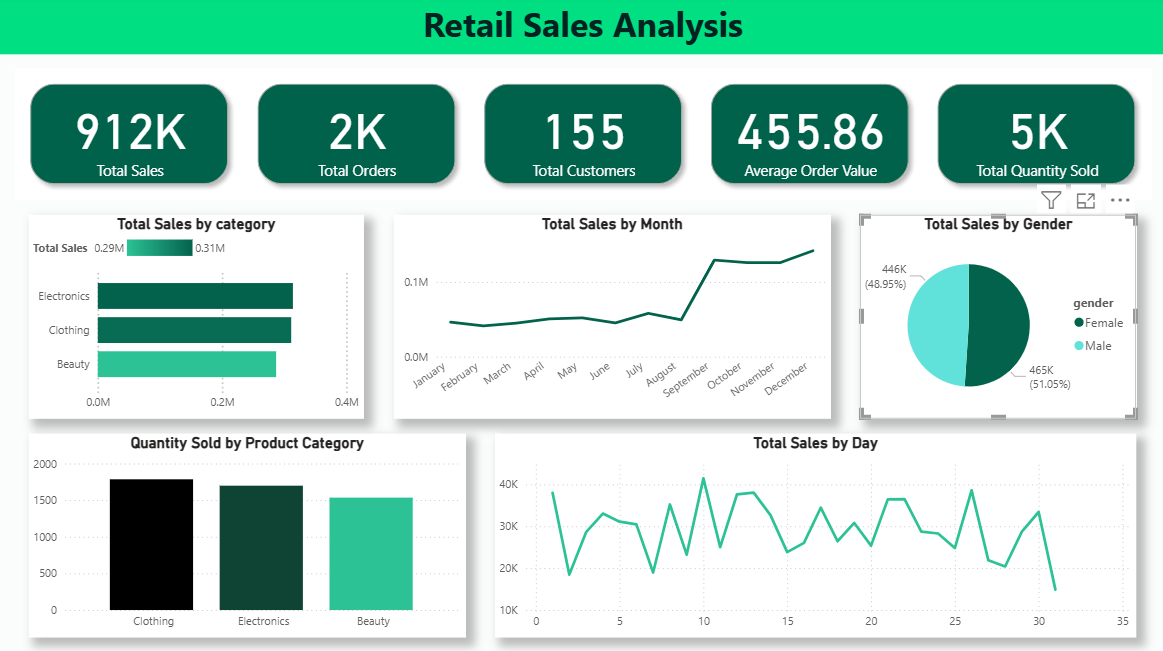
A simple SQL project analyzing retail sales data. Includes database setup, data cleaning, EDA, and answering business questions using SQL queries.
Power BI & SQL
I’m open to career opportunities, internships, and collaborative projects. Feel free to reach out, and I’ll get back to you soon.
Phone
(+94) 785322986
msachini959@gmail.com
Address
No:151/1 Dambarawa, Mahiyanganaya